Lab Setup
You'll use two sets of tools in this class: an x86 emulator, QEMU, for running your kernel; and a compiler toolchain, including assembler, linker, C compiler, and debugger, for compiling and testing your kernel. This page has the information you'll need to do on our OS (jos.utdallas.edu) server. This class assumes familiarity with Unix commands throughout.
For your convenience, the CS 4348 staff has prepared a server environment that pre-configured all required toolchain, and you can get access to those toolchain by following the steps listed below.
Connect to the VPN
If you are outside the UTD campus, follow the instructions here to install and connect to the UTD VPN before proceeding to the next step.
Login to the OS server
Connect to the OS server.
On Linux/MacOS, running the following command will let you connect to the server:
[host] $ ssh NetID@jos.utdallas.edu
e.g., my NetID is cxk200010, then,
[host] $ ssh cxk200010@jos.utdallas.edu
On Windows, you may connect to server through your SSH client, but we highly recommend you to use Windows Subsystem for Linux (WSL), which can run a Linux distribution on top of Windows 10. You can find more information about installing and enabling WSL at here (We recommend installing Ubuntu).
Your initial temporary password should have been sent/announced to you by the CS 4348 staff. When you login for the first time, the system will require you to change your password. Make sure to use a strong password (at least 12 characters long, use uppercase and lowercase letters, numbers and special symbols).
You may setup ssh public/private key pair to log on to the server w/o typing password. If you would like to do so, please follow the instruction in the next step.
Creating an SSH key
If you already have your SSH public/private key pair, then you do not need to follow this step. What you need is just preparing id_rsa.pub or id_ecdsa.pub, etc., to register your public key to the server.
If you do not have one, please run the following command in jos:
[jos] $ ssh-keygen -t ecdsa
Generating public/private ecdsa key pair.
Enter file in which to save the key (/home/cxk200010/.ssh/id_ecdsa):
Enter passphrase (empty for no passphrase):
Enter same passphrase again:
Your identification has been saved in /home/cxk200010/.ssh/id_ecdsa.
Your public key has been saved in /home/cxk200010/.ssh/id_ecdsa.pub.
The key fingerprint is:
SHA256:WDijyTgH9drAraogKkpB36rqea2S8WUf93C5NAFeDWY cxk200010@utdallas.edu
The key's randomart image is:
+---[ECDSA 256]---+
|    .      Eo    |
|   o o . .o. .   |
| .. o * o o      |
|. .+.B = . .     |
| .o.B.o S   o    |
| ..+.o . o =     |
|o.=.+ . o = o    |
|*+oo . .   o     |
|X+o..            |
+----[SHA256]-----+
After running this, you may find id_ecdsa.pub from ~/.ssh or your specified directory.
[jos] $ cat ~/.ssh/id_ecdsa.pub
ecdsa-sha2-nistp256 AAAAE2VjZHNhLXNoYTItbmlzdHAyNTYAAAAIbmlzdHAyNTYAAABBBFRxlq/fIouV7KflGVEwL04/yIprKdtf9KYOHk8gAbtIxocFFsAgBuEzRg4EtjQEYnitroSm2F14mHy2cz27+ho= cxk200010@utdallas.edu
Copy the text starts with ssh-rsa or ecdsa-sha2-nistp256 (the entire text), and use the text to register your public key to GitLab.
CS 4348 GitLab registration
We will use a private GitLab server to collect all your lab assignment submissions. Note that this GitLab, operated in-house at UTD, is different with the regular GitLab you may access from https://gitlab.com/.
So you will need an account on our GitLab server, and the next step is to create an account on the s3lab.utdallas.edu server.
When you register your account, make sure the following:
Use your NetID as your username (but not your usual username/ID for a random website).
Use NetID@utdallas.edu as your e-mail address (you will not get the confirmation e-mail message if you use other than utdallas.edu e-mail address).
After confirming the message, please log-on to the GitLab, and click the circle at the top-right, and click 'Settings' to go to the settings menu.
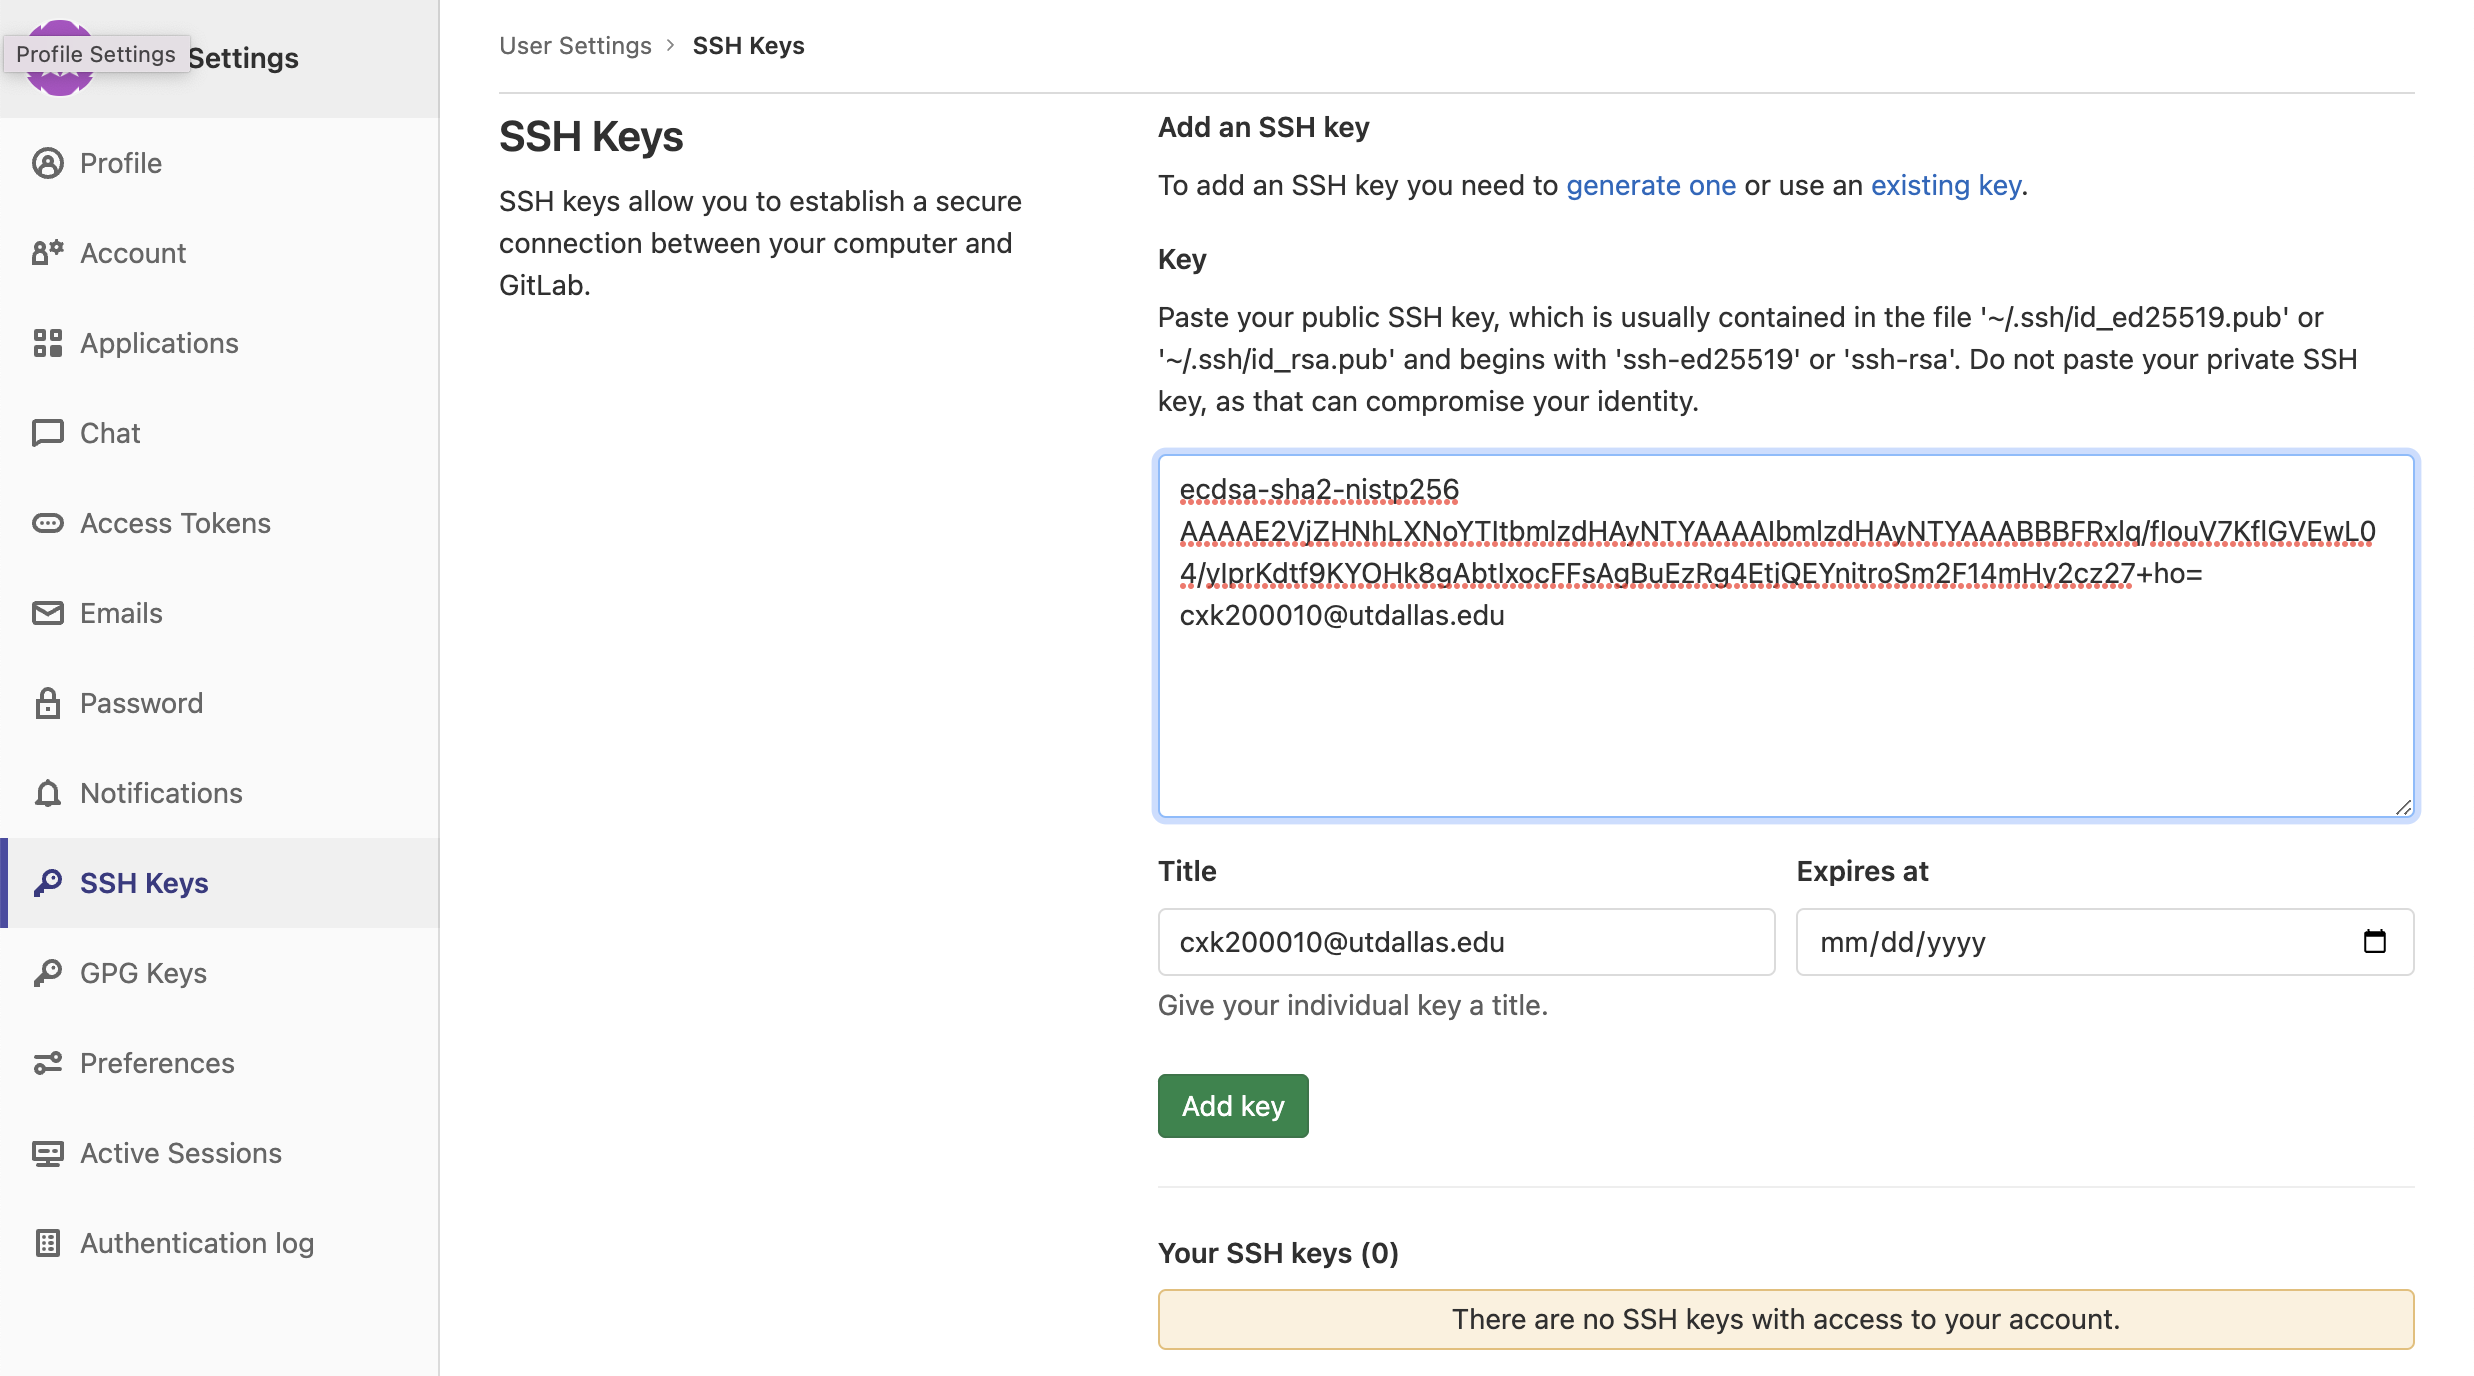
Click SSH Keys from the settings menu on the left.
Then, please copy the content of SSH public key (a string starts with ssh-rsa, ssh-ecdsa, or ssh-ed25519, etc.) that you already have or just created in the previous step.
After that, paste your public key in the 'Key' field. And you can add your ssh-public key.
Forking the Lab
After registering yourself to the GitLab, you can 'fork' the lab as your repository. To do this, please visit the lab repository and click 'fork'.
Cloning the lab
# in server, clone the repository
[jos] $ git clone ssh://git@s3lab.utdallas.edu:2224/NetID/jos.git
Cloning into jos...
$ cd jos
You must change NetID part to your NetID, for example, my NetID is cxk200010, then:
# in server, clone the repository
[jos] $ git clone ssh://git@s3lab.utdallas.edu:2224/cxk200010/jos.git
Cloning into jos...
$ cd jos
To commit and push to the repository, you may want to setup your git information by running the following commands (if you have not done this before...). Make sure to update the NetID and YourName parts:
[jos] $ git config --global user.email "NetID@utdallas.edu"
[jos] $ git config --global user.name "YourName"
[jos] $ git config --global core.editor /usr/bin/vim
[jos] $ git config --global push.default simple
[jos] $ git config --global core.autocrlf false
Updating your student.info file
After having forked and cloned your repository, your first task to finish is to update the student.info file in your repository. Please fill the information (your NetID, name, and your class section) in the file.
The reason why we collect such information is to match your repository to your account at UTD (to collect and record your scores).
NetID        : cxk200010
Name         : Chung Hwan Kim
Class Section: cs4348.004
Right now, it has some placeholder information, and please change it to your information. After making changes, you can make it accessible on our gitlab server by doing add, commit, and push. You can do that by running the follwing commands:
[jos] $ git status

... see that your student.info is edited

[jos] $ git add -A
[jos] $ git commit

.. write some commit messages in the editor

[jos] $ git push

.. this will push the change in the remote server (our gitlab server)
After pushing your changes, you can verify if that is available remotely by visiting your repository website on our gitlab server.
Running the setup script
Next, please run the setup script for the lab. The script is located at:
/usr/local/bin/cs4348-setup
[jos] $ /usr/local/bin/c4348-setup
Cloning into '/home/cs4348/.cs4348'...
remote: Enumerating objects: 467, done.
remote: Counting objects: 100% (467/467), done.
remote: Compressing objects: 100% (187/187), done.
remote: Total 467 (delta 283), reused 457 (delta 274), pack-reused 0
Receiving objects: 100% (467/467), 15.41 MiB | 18.24 MiB/s, done.
Resolving deltas: 100% (283/283), done.


Do you want to install gdb-dashboard and peda (disabled by default) to ~/.gdbinit (y/n)? y
y
Do you want to install cs4348 custom tmux configuration (y/n)? y
y
Do you want to install .bashrc (y/n)? y
y
Do you want to install .vimrc and vim plugins (y/n)? y
y
Error detected while processing /home/cs4348/.vimrc:
line   20:
E185: Cannot find color scheme 'angr'
Press ENTER or type command to continue
The script will clone the prepared environmental scripts (.dotfiles) and setup gdb, tmux, bash, and vim.
If you wish to use the prepared dotfiles by CS 4348 staff, then please type 'y' at each question from the script. In this case, all your existing dotfiles will be saved as .dotfile_name.bak, e.g., .vimrc.bak or .bashrc.bak, in your home directory.
If you wish to keep your settings for any of them, please type 'n' for the corresponding question.
Tool guide (not required for setup, just for FYI)
Familiarity with your environment is crucial for productive development and debugging. This page gives a brief overview of the JOS environment and useful GDB and QEMU commands. Don't take our word for it, though. Read the GDB and QEMU manuals. These are powerful tools that are worth knowing how to use.
Note
- Debugging tips:
- Reference:
Debugging tips
Kernel
GDB is your friend. Use the qemu-nox-gdb target
to make QEMU wait for
GDB to attach. See the GDB reference below for some commands
that are useful when debugging kernels.
If you're getting unexpected interrupts, exceptions, or triple faults, you can ask QEMU to generate a detailed log of interrupts using the -d argument.
To debug virtual memory issues, try the QEMU monitor commands info
mem (for a high-level overview) or info
pg (for lots of detail). Note that these commands
only display the current page table.
(Lab 4+) To debug multiple CPUs, use GDB's thread-related commands like
thread and info threads.
User environments (Lab 3+)
GDB also lets you debug user environments, but there are a few things you need to watch out for, since GDB doesn't know that there's a distinction between multiple user environments, or between user and kernel.
You can start JOS with a specific user environment using make
run-<name> (or you can edit kern/init.c directly).
To make QEMU wait for GDB to attach, use the
run-<name>-gdb variant.
You can symbolically debug user code, just like you can kernel code, but
you have to tell GDB which symbol table to use with the
symbol-file command, since it can only use one
symbol table at a time. The provided .gdbinit loads the kernel
symbol table, obj/kern/kernel. The symbol table for a user
environment is in its ELF binary, so you can load it using symbol-file
obj/user/name. Don't load symbols from any .o files, as those
haven't been relocated by the linker (libraries are statically linked
into JOS user binaries, so those symbols are already included in each
user binary). Make sure you get the right user binary; library
functions will be linked at different EIPs in different binaries and GDB
won't know any better!
(Lab 4+) Since GDB is attached to the virtual machine as a whole, it
sees clock interrupts as just another control transfer. This makes it
basically impossible to step through user code because a clock interrupt
is virtually guaranteed the moment you let the VM run again. The
stepi command works because it suppresses interrupts, but
it only steps one assembly instruction. Breakpoints
generally work, but watch out because you can hit the same EIP in a
different environment (indeed, a different binary altogether!).
References
JOS makefile
The JOS Makefile includes a number of phony targets for running JOS
in various ways. All of these targets configure QEMU to listen for GDB
connections (the *-gdb targets also wait for this connection). To
start once QEMU is running, simply run gdb from your lab directory. We
provide a .gdbinit file that automatically points GDB at QEMU, loads
the kernel symbol file, and switches between 16-bit and 32-bit mode.
Exiting GDB will shut down QEMU.
- make qemu-nox
Like
make qemu, but run with only the serial console. To exit, pressCtrl-a x. This is particularly useful over SSH connections to the OS server because the VGA window consumes a lot of bandwidth.- make qemu-nox-gdb
A combination of the
qemu-noxandqemu-gdbtargets.- make run-name
(Lab 3+) Run user program name. For example,
make run-hellorunsuser/hello.c.- make run-name-nox, run-name-gdb, run-name-gdb-nox,
(Lab 3+) Variants of
run-namethat correspond to the variants of theqemutarget.
The makefile also accepts a few useful variables:
- make V=1 ...
Verbose mode. Print out every command being executed, including arguments.
- make V=1 grade
Stop after any failed grade test and leave the QEMU output in
jos.outfor inspection.- make QEMUEXTRA='args' ...
Specify additional arguments to pass to QEMU.
JOS obj/
When building JOS, the makefile also produces some additional output files that may prove useful while debugging:
obj/boot/boot.asm,obj/kern/kernel.asm,obj/user/hello.asm, etc.Assembly code listings for the bootloader, kernel, and user programs.
obj/kern/kernel.sym,obj/user/hello.sym, etc.Symbol tables for the kernel and user programs.
obj/boot/boot.out,obj/kern/kernel,obj/user/hello, etcLinked ELF images of the kernel and user programs. These contain symbol information that can be used by GDB.
GDB
See the GDB manual for a full guide to GDB commands. Here are some particularly useful commands for the labs, some of which don't typically come up outside of OS development.
- Ctrl-c
Halt the machine and break in to GDB at the current instruction. If QEMU has multiple virtual CPUs, this halts all of them.
- c (or continue)
Continue execution until the next breakpoint or
Ctrl-c.- si (or stepi)
Execute one machine instruction.
- b function or b file:line (or breakpoint)
Set a breakpoint at the given function or line.
- b *addr (or breakpoint)
Set a breakpoint at the EIP addr.
- set print pretty
Enable pretty-printing of arrays and structs.
- info registers
Print the general purpose registers,
eip,eflags, and the segment selectors. For a much more thorough dump of the machine register state, see QEMU's owninfo registerscommand.- x/Nx addr
Display a hex dump of N words starting at virtual address addr. If N is omitted, it defaults to 1. addr can be any expression.
- x/Ni addr
Display the N assembly instructions starting at addr. Using
$eipas addr will display the instructions at the current instruction pointer.- symbol-file file
(Lab 3+) Switch to symbol file file. When GDB attaches to QEMU, it has no notion of the process boundaries within the virtual machine, so we have to tell it which symbols to use. By default, we configure GDB to use the kernel symbol file,
obj/kern/kernel. If the machine is running user code, sayhello.c, you can switch to the hello symbol file usingsymbol-file obj/user/hello.
Note
QEMU represents each virtual CPU as a thread in GDB, so you can use all of GDB's thread-related commands to view or manipulate QEMU's virtual CPUs.
- thread n
GDB focuses on one thread (i.e., CPU) at a time. This command switches that focus to thread n, numbered from zero.
- info threads
List all threads (i.e., CPUs), including their state (active or halted) and what function they're in.
QEMU
QEMU includes a built-in monitor that can inspect and modify the machine state in useful ways. To enter the monitor, press Ctrl-a c in the terminal running QEMU. Press Ctrl-a c again to switch back to the serial console.
For a complete reference to the monitor commands, see the QEMU manual. Here are some particularly useful commands:
- xp/Nx paddr
Display a hex dump of N words starting at physical address paddr. If N is omitted, it defaults to 1. This is the physical memory analogue of GDB's
xcommand.- info registers
Display a full dump of the machine's internal register state. In particular, this includes the machine's hidden segment state for the segment selectors and the local, global, and interrupt descriptor tables, plus the task register. This hidden state is the information the virtual CPU read from the GDT/LDT when the segment selector was loaded. Here's the CS when running in the JOS kernel in lab 1 and the meaning of each field:
CS =0008 10000000 ffffffff 10cf9a00 DPL=0 CS32 [-R-]
CS =0008The visible part of the code selector. We're using segment 0x8. This also tells us we're referring to the global descriptor table (0x8&4=0), and our CPL (current privilege level) is 0x8&3=0.
10000000The base of this segment. Linear address = logical address + 0x10000000.
ffffffffThe limit of this segment. Linear addresses above 0xffffffff will result in segment violation exceptions.
10cf9a00The raw flags of this segment, which QEMU helpfully decodes for us in the next few fields.
DPL=0The privilege level of this segment. Only code running with privilege level 0 can load this segment.
CS32This is a 32-bit code segment. Other values include
DSfor data segments (not to be confused with the DS register), andLDTfor local descriptor tables.[-R-]This segment is read-only.
- info mem
(Lab 2+) Display mapped virtual memory and permissions. For example,
ef7c0000-ef800000 00040000 urw
efbf8000-efc00000 00008000 -rw
tells us that the 0x00040000 bytes of memory from 0xef7c0000 to 0xef800000 are mapped read/write and user-accessible, while the memory from 0xefbf8000 to 0xefc00000 is mapped read/write, but only kernel-accessible.
QEMU also takes some useful command line arguments, which can be passed
into the JOS makefile using the QEMUEXTRA
variable.
- make QEMUEXTRA='-d int' ...
Log all interrupts, along with a full register dump, to
qemu.log. You can ignore the first two log entries, "SMM: enter" and "SMM: after RMS", as these are generated before entering the boot loader. After this, log entries look like4: v=30 e=0000 i=1 cpl=3 IP=001b:00800e2e pc=00800e2e SP=0023:eebfdf28 EAX=00000005 EAX=00000005 EBX=00001002 ECX=00200000 EDX=00000000 ESI=00000805 EDI=00200000 EBP=eebfdf60 ESP=eebfdf28 ...
The first line describes the interrupt. The
4:is just a log record counter.vgives the vector number in hex.egives the error code.i=1indicates that this was produced by anintinstruction (versus a hardware interrupt). The rest of the line should be self-explanatory. Seeinfo registersfor a description of the register dump that follows.Note: If you're running a pre-0.15 version of QEMU, the log will be written to
/tmpinstead of the current directory.